
Data Analysis with Agentic AI (Part 1 - The Vision)
Discover how an agentic workflow transforms data analysis from a manual chore into an intelligent, automated journey, delivering actionable insights in minutes

Introduction
Dashboards were yesterday's promise: to automate data analysis and make data readily available to business users. But they still don't address the key problem for business folks and remain only a half-baked solution. While dashboards excel at extracting data from different sources, combining them, and creating reports and visualizations, they easily break if data sources change, require constant maintenance, and frequently miss actionable insights. This means you're still spending hours poring over dashboard reports to glean insights instead of making crucial decisions.
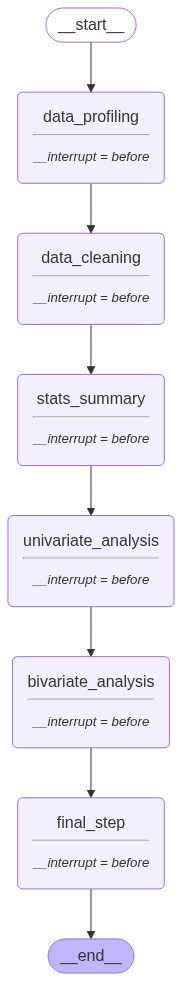
Now, imagine an AI system that doesn't just process data, but truly thinks like a data scientist, making intelligent decisions along the way. A LangGraph-powered agentic workflow can transform your data analysis game. This workflow automates the entire data analysis lifecycle – from profiling and cleaning to generating comprehensive reports and actionable recommendations. It frees you from the tedious, repetitive tasks, allowing you to focus on the high-value strategic thinking that truly moves the needle. Simply upload your data, and watch as the system intelligently processes your data, providing you with detailed reports and clear recommendations in minutes. It's an intuitive, guided journey from raw data to actionable insights, without writing a single line of code yourself.
About the Author:
Arun Subramanian: Arun is an Associate Principal of Analytics & Insights at Amazon Ads, where he leads development and deployment of innovative insights to optimize advertising performance at scale. He has over 12 years of experience and is skilled in crafting strategic analytics roadmap, nurturing talent, collaborating with cross-functional teams, and communicating complex insights to diverse stakeholders.
Why Agentic Workflow for Automation?
Data Analysis: A Deterministic Process, Right? At its core, data analysis involves a series of logical, often deterministic steps. You might think, "Can't I just write a Python script to automate this?" And you'd be right, to a point! Simple tasks can indeed be automated with straightforward code. Here's the catch: real-world data analysis isn't just about executing lines of code. It's packed with nuanced decision-making and the ability to connect disparate findings!! Think about it:
- Handling missing values: Do you impute, drop, or use a more sophisticated method? This isn't a one-size-fits-all answer; it depends on the data, the context, and the impact on analysis.
- Treating outliers: Are they errors or significant anomalies? How should they be handled? ow should they be handled to avoid skewing results while preserving genuine insights?
- Feature engineering: What new variables should you create from existing ones to unlock deeper insights? This requires creative thinking and domain knowledge.
- Data visualizations: Which chart best tells the story of your data, considering the audience and the message?
- Synthesizing Insights: Beyond individual tasks, a human data scientist excels at connecting the dots across different findings. They might see a pattern in missing data, relate it to an outlier, and then infer a potential issue in data collection. They don't just generate reports; they interpret them, identify root causes, and formulate actionable recommendations.
This holistic, iterative, and often intuitive process of deriving meaning and actionable insights from raw data was previously difficult to automate with traditional scripting. These are the moments where a data scientist's expertise truly shines. And this is precisely where an agentic workflow, powered by Large Language Models (LLMs) with the right tools and prompts, steps in to automate this complex decision-making and insight-generation process, mimicking human intelligence.
Core Architectural Principles: Your Blueprint for Success
We'll show you why LangGraph was the ultimate choice for building this system. It offers unmatched modularity, crystal-clear transparency (you can literally see your workflow!), seamless state management, and powerful re-entrancy, making complex workflows manageable and robust. It's the brain that coordinates all the specialized agents.
To truly grasp how our agentic system works, let's peek behind the curtain at LangGraph's core mechanics. Imagine a simple workflow: refining a topic and generating a joke. This minimal example perfectly illustrates the power of LangGraph's graph-based orchestration, which is the foundation for our complex data analysis pipeline.
Defining the State:
At the heart of any LangGraph workflow is the State. Think of it as the central memory that carries all the information from one step to the next. For our joke example, it might look like this:
from typing import TypedDict

class State(TypedDict):
    topic: str
    joke: str
In our data analysis app, this State object becomes much richer, carrying your dataset location, profiling results, analysis outputs, and more, ensuring seamless data flow.
Creating Node Functions:
Each "node" in LangGraph is simply a Python function that takes the current State, performs a specific task, and returns an updated State.
def refine_topic(state: State):
    return {"topic": state["topic"] + " and cats"}

def generate_joke(state: State):
    return {"joke": f"This is a joke about {state['topic']}"}
In our data analysis workflow, these nodes are sophisticated agents, performing tasks like "profile data," "clean data," or "generate report."
Building the Graph:
LangGraph lets you define the flow between these nodes, creating a directed graph. You specify the starting point, the sequence of nodes, and where the workflow ends. A powerful feature is the ability to compile the graph with an interrupt_before setting, which allows the workflow to pause at a specific node, enabling human intervention or review.
from langgraph.graph import StateGraph, START, END
from langgraph.checkpoint.memory import MemorySaver

graph = (
  StateGraph(State)
  .add_node(refine_topic)
  .add_node(generate_joke)
  .add_edge(START, "refine_topic")
  .add_edge("refine_topic", "generate_joke")
  .add_edge("generate_joke", END)
  .compile(interrupt_before=[ "generate_joke"], checkpointer = MemorySaver())
)
This structure ensures each step happens in the right order, and results can be checkpointed, inspected, or even modified at any stage – crucial for complex data analysis.
Running the Graph (Streaming Execution & Human-in-the-Loop):
You can then run the graph, often in a streaming fashion, allowing you to see intermediate results as the workflow progresses. The stream_mode="values" is particularly useful here, as it yields the full state at each step, making it easy to inspect. When interrupt_before is set, the stream will pause, giving you a chance to intervene.
import uuid

thread_id = str(uuid.uuid4())
thread = {"configurable": {"thread_id": thread_id}}

state = None
for chunk in graph.stream({"topic":"ice cream"}, thread, stream_mode="values"):
    state = chunk

print(state)

# output
# {'topic': 'ice cream and cats'}
For our data analysis app, this streaming allows you to monitor progress, debug issues, or even interact with the workflow at different stages, giving you crucial "human-in-the-loop" control.
Updating State and Continuing Execution:
One of LangGraph's most powerful features is the ability to update_state at any node and resume execution from there. This is invaluable for workflows that might require user intervention, error recovery, or iterative refinement. You can effectively "time-travel" back to a specific point, modify the state, and then let the workflow continue.
# After the pause, we can inspect the state and update it
# Let's say we want to change the topic before the joke is generated

new_topic = "ice cream and hilarious cats"
graph.update_state(thread, {"topic": new_topic}, as_node="refine_topic_node")

# Now, resume the stream. The graph will continue from where it left off,
# but with our updated state.
for chunk in graph.stream(None, thread, stream_mode="values"):
    state = chunk
print(state)

# output
# {'topic': 'ice cream and hilarious cats', 'joke': 'This is a joke about ice cream and hilarious cats'}
This capability is vital for building robust data analysis pipelines that can adapt to new information, incorporate user feedback, or recover from errors by correcting the state and re-running specific parts of the graph.
Next Steps
You've seen the vision and understood the core mechanics of how LangGraph orchestrates intelligent agents, including its powerful human-in-the-loop capabilities.
Next up: "Structuring Your Agentic Data Analysis (Part 2- The Architecture) " – where we'll pull back the curtain and show you the full, intricate architecture of our LangGraph-powered data analysis tool!
Thank you for starting this series, waiting for next part.