
Building your own Recommender System - Part 2/4
In Part 2 of the series, master the art of evaluating recommender systems with key metrics, practical insights, and best practices to deliver relevant, diverse, and user-centric recommendations.


Welcome to the “Build Your Own Recommender Systems” series, created by Manisha Arora, Data Science Lead at Google Ads and Arun Subramanian, Associate Principal of Analytics & Insights at Amazon Ads. This 4-part series is designed to guide you through the foundational knowledge and hands-on techniques you need to create personalized recommendation engines. From exploring different types to implementing your own, this series is designed to give you the skills to build effective, data-driven recommendation systems that users love.
In Part 1, we provided an overview of recommender systems and examined different types, setting the foundation for creating personalized recommendations. In this installment, we’ll dive into Evaluating Recommender Systems, where we’ll discuss key metrics, practical considerations, and the various factors that impact recommendation quality. Whether you're working on rating predictions or designing highly relevant Top-N recommendations, Part 2 will equip you with the insights to measure, refine, and enhance your recommender system’s performance.
Evaluating Recommender Systems
When developing a recommender system, selecting the right evaluation metrics is crucial. Unlike traditional predictive models, where accuracy or precision might be primary concerns, recommender systems require more nuanced metrics to capture relevance, user satisfaction, and system performance. In this part, we’ll explore key evaluation metrics, their applications, and some best practices for assessing recommender systems effectively.
Why Evaluating Recommender Systems is Challenging
The complexity of recommender systems lies in the subjective nature of “good recommendations.” A recommendation may be accurate but not relevant, or it may meet a user’s interests but not offer diversity. Therefore, understanding different evaluation metrics allows us to measure the system’s effectiveness from multiple angles, balancing accuracy, relevance, diversity, and novelty.
Evaluation Types
Evaluation of recommender systems generally falls into three categories:
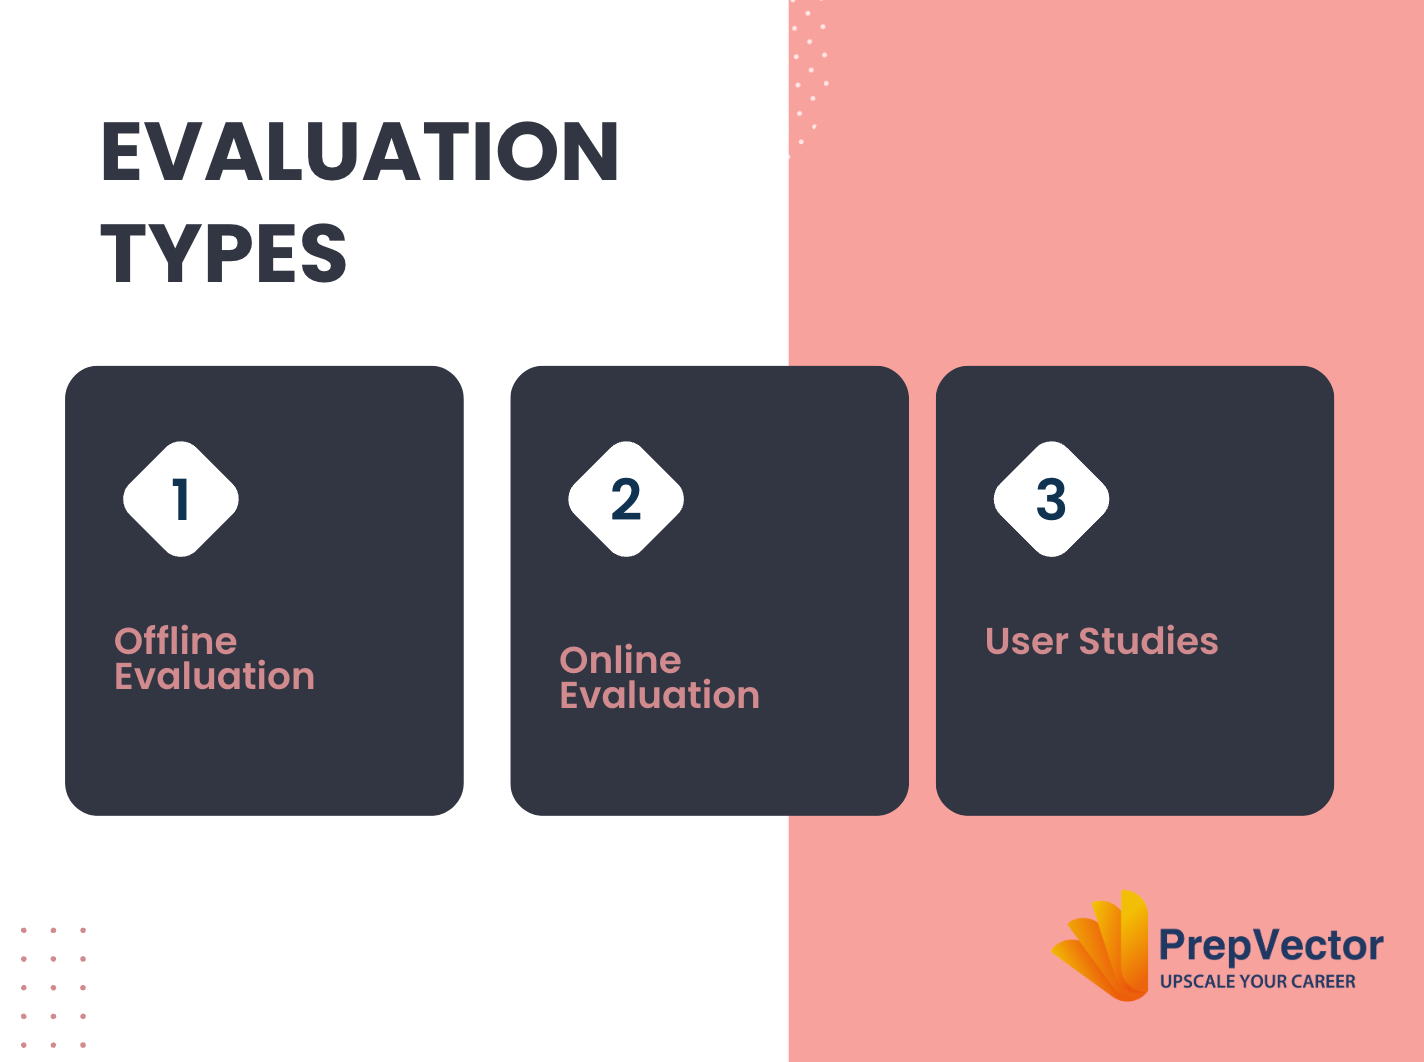
Offline Evaluation: Conducted on historical data to test the algorithm in a simulated environment.
Online Evaluation: Measures system performance in a live environment, often through A/B testing.
User Studies: Direct feedback from users to assess satisfaction, preference, and relevance.
Each type has its place, but offline evaluation is usually the starting point for model selection and optimization, while online evaluation and user studies provide valuable feedback in production environments.
Key Evaluation Metrics for Recommender Systems
Recommender systems can be evaluated using standard machine learning techniques, such as the train/test approach or k-fold cross-validation. Various accuracy metrics are available for this purpose, tailored to the specific context of the business domain.
In practice, companies prioritize delivering the most relevant recommendations to their customers, which often leads them to use metrics that reflect user satisfaction and engagement. Conversely, in academic settings, researchers frequently focus on how well recommender systems predict user-provided ratings to assess their accuracy.
However, relying solely on rating prediction accuracy offers limited value; consumers care less about how accurately their ratings are predicted and more about receiving relevant product recommendations.
These two perspectives highlight distinct challenges, necessitating different sets of metrics for effective evaluation. Evaluation metrics for recommender systems fall into three broad categories: accuracy metrics, coverage metrics, and responsiveness metrics.
1. Accuracy Metrics
These metrics measure how closely the recommendations align with user interests or past behaviors.
Rating Prediction Accuracy Metrics
For cases where rating predictions are required, several traditional metrics apply:
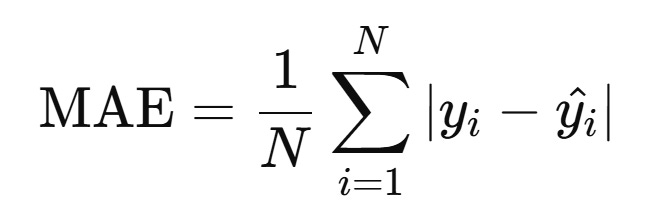
Mean Absolute Error (MAE): Measures the average magnitude of errors in predictions.
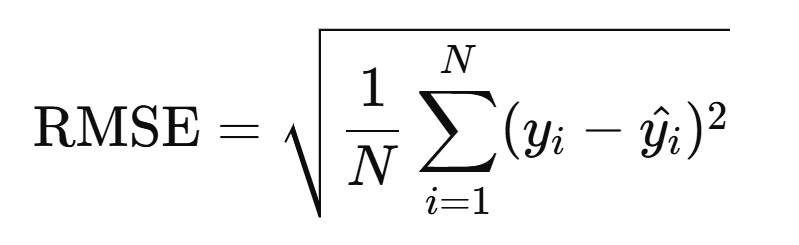
Root Mean Squared Error (RMSE): Like MAE but gives more weight to larger errors.
2. Top-N Recommendation Accuracy Metrics
In many real-world scenarios, we’re interested in the top-N items a user will engage with, so these metrics become critical:
Precision and Recall: In a recommendation context, precision is the percentage of relevant items among the recommended items, and recall is the percentage of relevant items recommended out of all relevant items.
Hit Rate: Using Leave-One-Out Cross-Validation (LOOCV), this metric measures how often a system correctly recommends an intentionally removed item during testing. It reflects how well the system predicts a single specific item, although hit rates tend to be low due to the difficulty of exact matches.
Average Reciprocal Hit Rate (ARHR): Similar to hit rate, but also accounts for where in the recommendation list the correct item appears. Higher ranks yield higher scores, which helps prioritize relevant recommendations near the top.
Cumulative Hit Rate (CHR): Evaluates hit rate for only the items that exceed a specified rating threshold, filtering out recommendations with low predicted ratings.
Rating Hit Rate (RHR): This breakdown of hit rate by rating score gives a more granular view of recommendation effectiveness, especially in distinguishing between recommendations that users might “like” vs. “love.”
3. Coverage, Diversity, and Novelty Metrics
These metrics go beyond accuracy to assess a system's ability to provide a varied, engaging experience that meets broader user needs.
Coverage: The percentage of available <user, item> pairs that the system can predict. Coverage often requires balancing with accuracy; if a system prioritizes rare items for broader coverage, it may sacrifice recommendation quality.
Diversity: Defined as 1− the average similarity between recommendation pairs, diversity measures the variation within a set of recommendations. High diversity generally improves user engagement, though excessively high diversity may produce irrelevant or unhelpful suggestions.
Novelty: Measures how often the system introduces new or less-popular items in recommendations. Striking the right balance here is essential to retain user interest—some familiarity is comforting, while too much novelty can feel disorienting.
4. Responsiveness and Churn Metrics
These metrics evaluate how adaptive and stable the system is in responding to user behavior changes.
Responsiveness: Measures how quickly the system updates recommendations based on new user actions, such as recent interactions or purchases. High responsiveness is challenging but essential to keep recommendations relevant.
Churn: Tracks how frequently recommendations change for a given user. While a certain amount of churn reflects responsiveness, excessive churn may frustrate users if recommendations seem inconsistent or lack coherence.
Practical Considerations for Evaluation
Align Metrics with Business Objectives: Different metrics matter depending on the business context. For instance, precision may be more important for e-commerce recommenders, while diversity could be a priority in content streaming.
Select an Appropriate Dataset and Sampling Approach: Choose a representative test set, ideally by sampling over time or user segments (new vs. returning users). This can reduce biases in evaluation and reflect real-world scenarios better.
Leverage Offline, Online, and User-Based Evaluations: Start with offline evaluations on historical data to refine the model, then validate with online A/B testing to measure real-world impact, and finally, collect user feedback for direct insights.
Combining Metrics: Rarely does one metric capture all aspects of a system's performance. Using a combination—such as Normalized Discounted Cumulative Gain(nDCG), hit rate, and diversity—often yields a more comprehensive view of the system's overall effectiveness.
Summary
Evaluating a recommender system requires balancing different metrics to align with both business goals and user satisfaction. By understanding the strengths and limitations of each metric, data scientists can design systems that are not only accurate but also relevant, diverse, and adaptable to users’ evolving preferences.
In Part 3 of this series, we’ll explore how to build a Content-Based Recommender System. We’ll dive into content profiling, user preference modeling, and practical techniques for generating recommendations that cater specifically to user tastes.